Microsoft Azure logging overview
- Azure diagnostic settings and diagnostic logs difference
- Azure application insights and azure monitor difference
- Azure application insights and azure analytics difference
- Azure monitor and azure analytics difference
- Azure metrics and azure analytics difference
- Azure activity logs
- Azure storage activity logs
- Azure storage analytics logs
- Azure app service logging
- Azure app service activity logs
- Azure app service application logging
- Azure app service web server logging
- Azure app service deployment logging
- Azure sql database audit logs
- Azure sql database diagnostic telemetry
- Azure sql database activity logs
Microsoft Azure has a lot of terms, notions, services, and features for logging and monitoring, which may sometimes overlap. They can lead to complete mess in your head if you do not make a decent effort to sort things out.
Logging Services Overview
Here is the list of the logging and monitoring services in Azure:
- Application Insights
- Activity Logs
- Diagnostic settings & Diagnostic logs
- Built-in logging mechanisms
- Azure Log Analytics
- Azure Monitor
Let’s dive a little to each of these services.
1. Application Insights
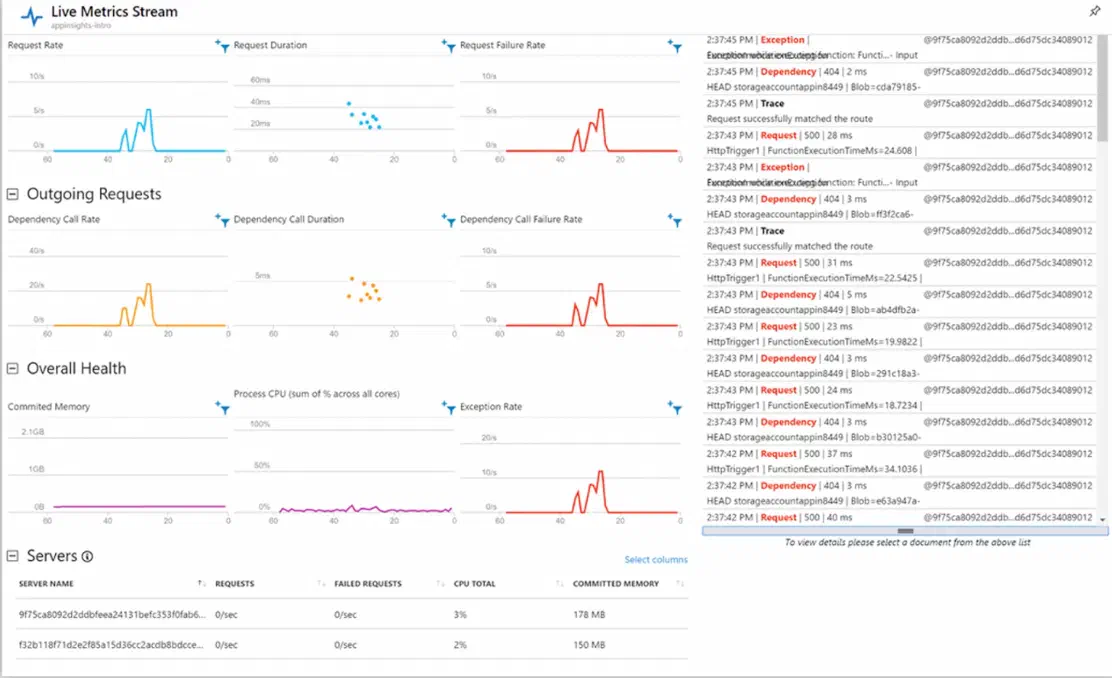
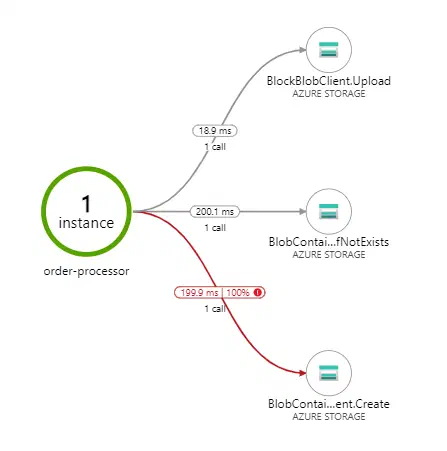
Application Insights are best suited for distributed logging, alerting and dashboards for our applications.
They help gain insights into the performance and usage of applications like dashboards and proactive alerting. Application-specific metrics, request rates and exception rates are also here. It can show entire user flow, that led to exception. Example: tracking page load times. Supported services: Web apps, API Management, Azure Functions, Virtual machines.
We can setup application insights on both three levels of the application: frontend (1), backend (2) and even external APIs. Part of these integrations available because of an Azure built-in integration, and part are available by leveraging App Insights SDK. Because of (1) we are available to track things like user behavior. If we don’t have ability to integrate SDK, we still can control the service calls.
As soon as we have some data in App Insights, we can set up alerts, Power BI, VS Studio integration, REST API or continuous export.
Live metrics stream & exception handling:
Distributed traces map:
2. Activity Logs
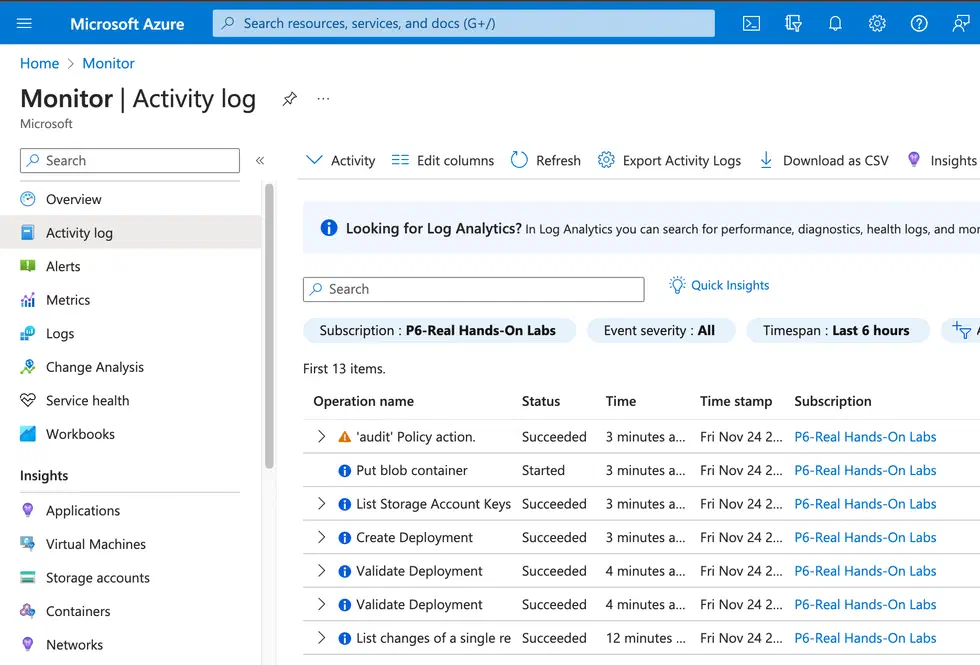
Most of the Azure services generate activity log, that you can see under Activity Monitor, more info here.
3. Diagnostic settings & Diagnostic logs
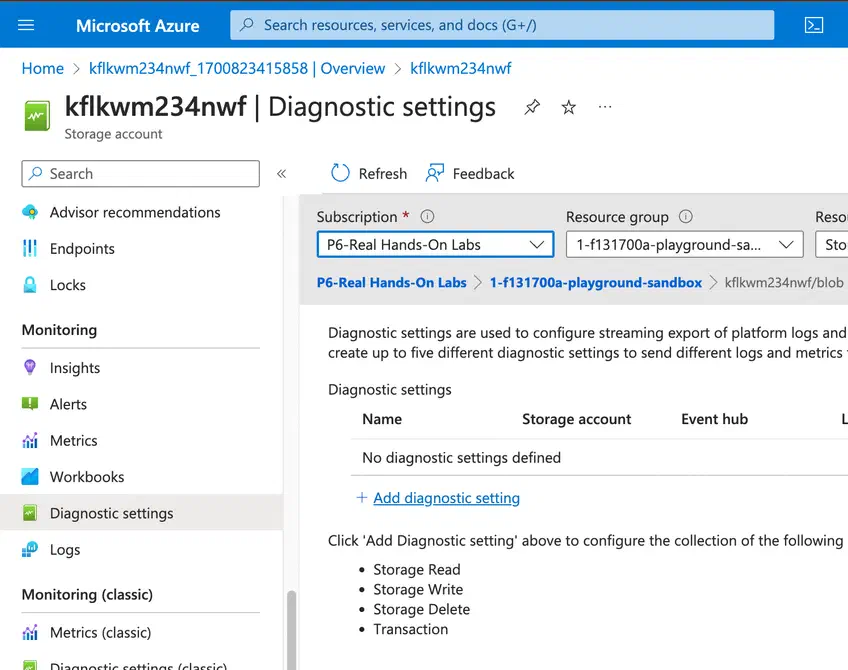
Diagnostic settings manage the flow of diagnostics data, while diagnostic logs are the actual data that flows through that channel. Diagnostic settings are the control mechanism, while diagnostic logs are the information being controlled.
Most of the Azure Services have Diagnostic settings. This feature doesn’t have something like a “central portal”. You need to find the appropriate section by yourself on the page of the Azure service you want to have diagnostic logs enabled. Consider this one for Storage Account:
Or this one for App Service Web App:
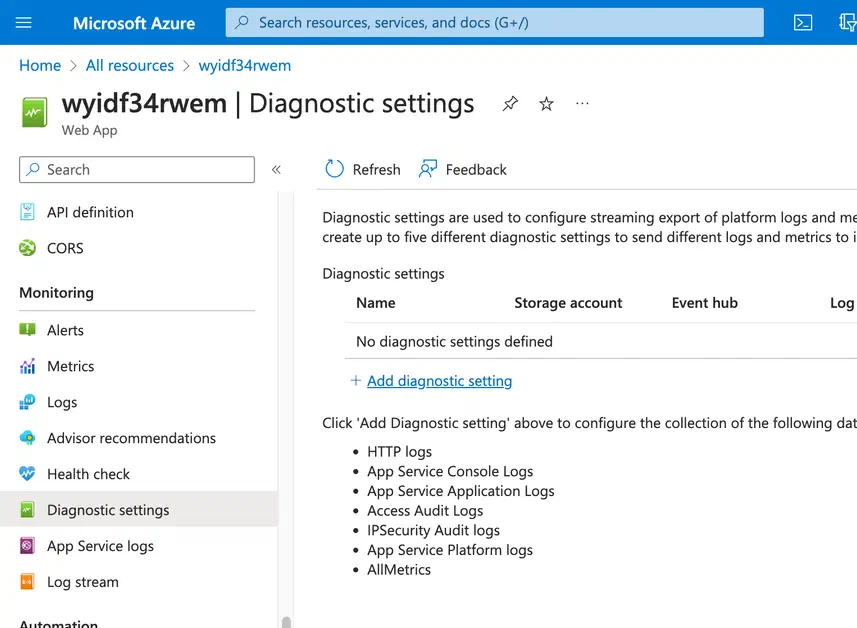
So, the space that you can use to enable and configure this feature is named Diagnostic settings. The logs themselves you are about to enable is named Diagnostic logs.
Keep in mind, that you have different types of Diagnostic logs for each Azure service. For example, you have these for Azure Storage Blob containers:
- Analytics logs. Detailed information about successful and failed requests to a storage service, more info here.
- Storage Read
- Storage Write
- Storage Delete
But for Azure App Service Web App you have a different set of categories:
- HTTP logs
- App Service Console Logs
- App Service Application Logs
- Access Audit Logs
- IPSecurity Audit Logs
- App Service Platform Logs
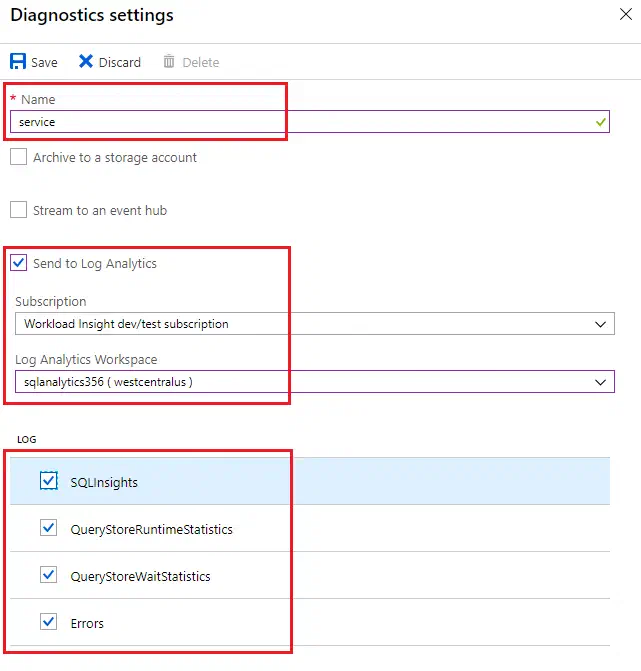
Example for Azure SQL Database is Diagnostic telemetry, more info here.
Here is an example of configuration:
And so on for other Azure services.
4. Built-in logging mechanisms
Some Azure services have their own logging dimensions. Let’s dive into some examples.
Azure App Service Web Apps diagnostic logging.
You can find them under App Service logs section, more info here. Here is a list of log types:
- Application logging. Logs messages generated by your application code
- Web server logging. Raw HTTP request data including HTTP method, resource URI, client IP, client port, user agent, response code, and so on.
- Detailed error messages. Copies of the .htm error pages that would have been sent to the client browser.
- Failed request tracing. Detailed tracing information on failed requests, including a trace of the IIS components used to process the request and the time taken in each component.
- Deployment logging. Logs for when you publish content to an app.
Here is a location:
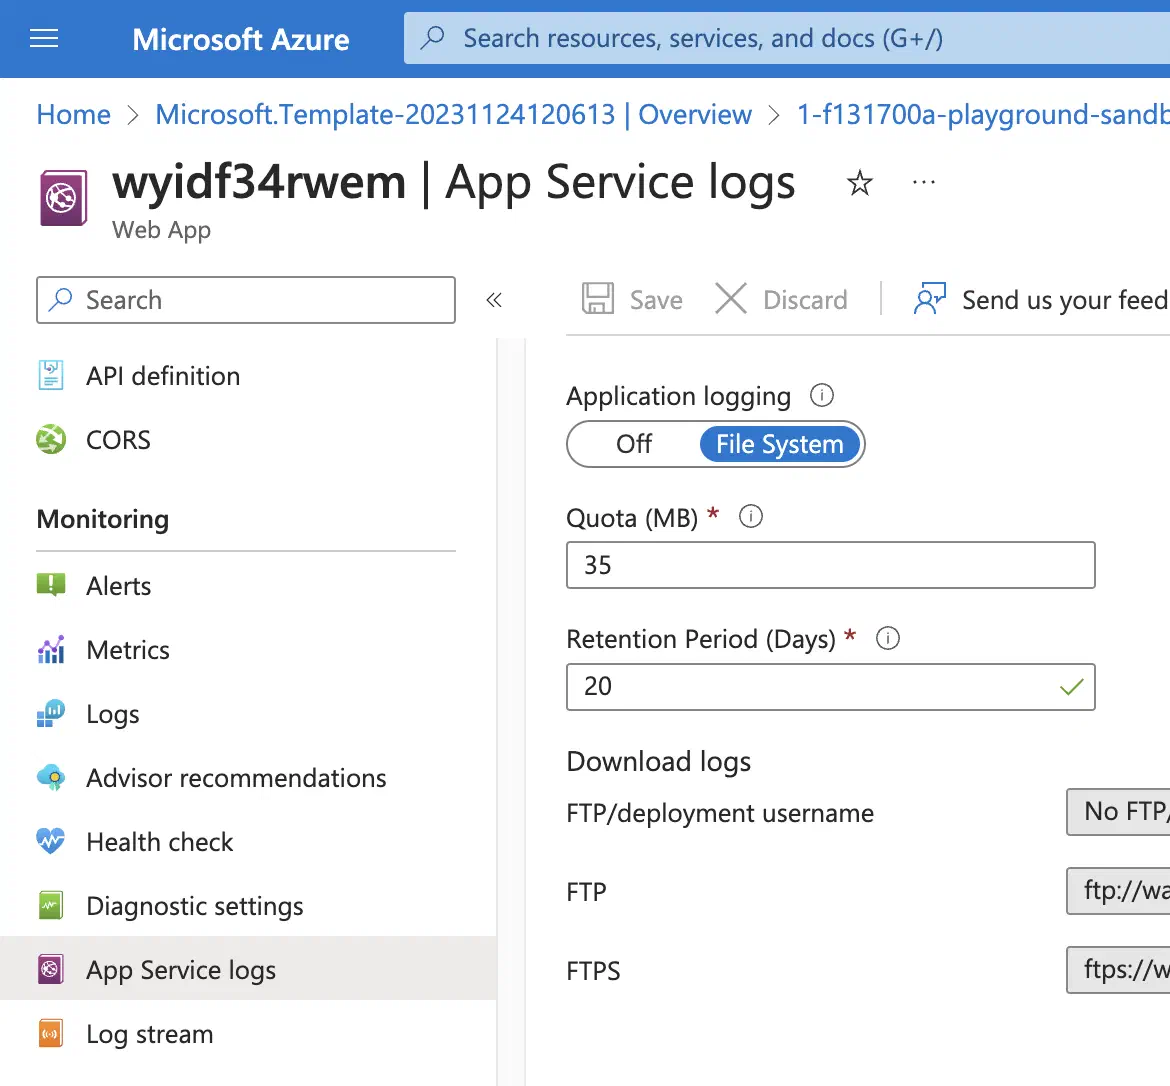
NOTE! You should not confuse this thing that is located under App Service logs, and that is named “diagnostic logging” in Microsoft documentation with Diagnostic settings and Diagnostic logs from section number two. Yeah, I don’t really like this naming mess either.
Here is a little hint: Diagnostic settings (and Diagnostic logs, that they produce) exist almost in every Azure service (and in App Service Web Apps too), but App Service logs (which are also named Diagnostic logging) exist only in App Service.
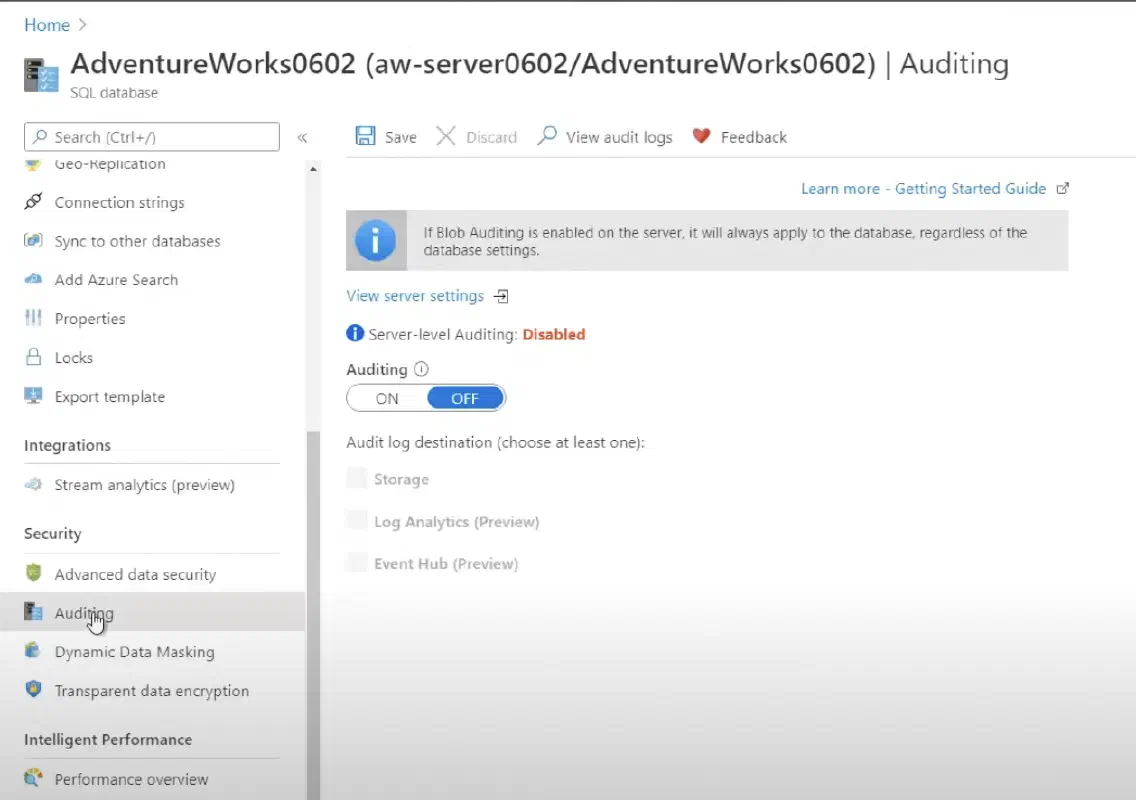
Azure SQL Database Audit logs
They allow you to track and record database activity. This can be useful for complying with regulatory requirements or for identifying potential security breaches.
Audit logs configuration:
5. Azure Log Analytics
It’s a tool you want to use whenever you want to centralize logs from various sources in the one place. In fact, you have Log Analytics workspace as a target when you configure Diagnostic setting.
Fun fact: Log Analytics workspace also has Diagnostic settings, and you can set the same workspace as a target for Diagnostic logs.
6. Azure Metrics
Azure Metrics is a feature of Azure Monitor, that gives you a central place to collect, analyze, and visualize telemetry data from your Azure resources.
7. Azure Monitor
Azure Monitor encompasses many Azure logging & monitoring features in one place. Log Analytics, as well as Azure Metrics, actually are a part of Azure Monitor functionality.
Here is a Log Analytics workspaces section in Monitor:
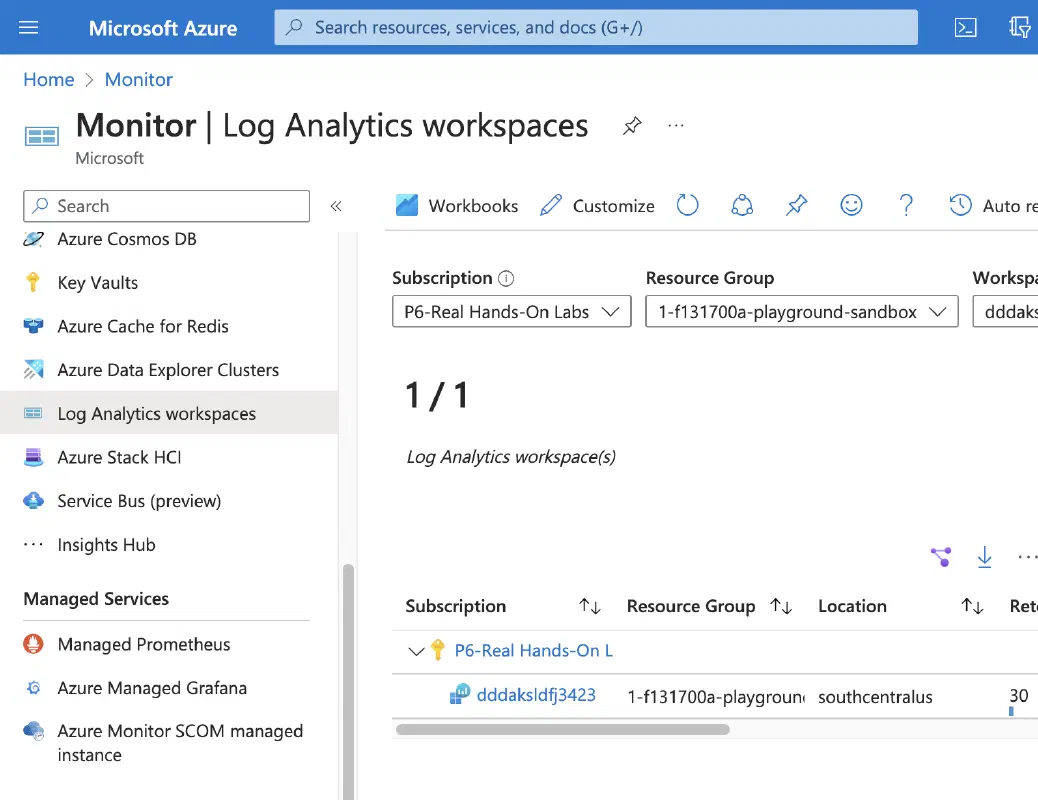
Here is a Metrics section within a Monitor:
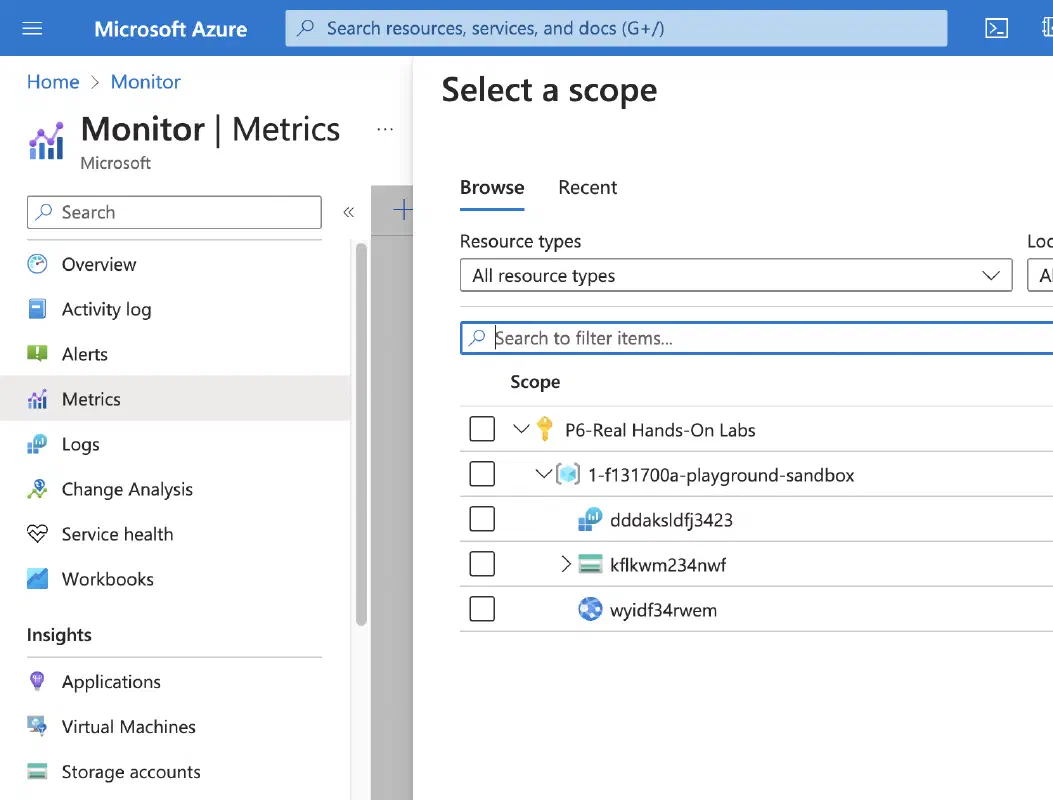
I hope you have read the article carefully, and now you have a better understanding of why we might need these or those Azure logging & monitoring services.