Detecting OT hardware implants: Blue Team perspective
Series Overview
This article is part of the series. Below are links to all posts in the series:- Architectural isolation, RF shielding of ICS cabinets, and physical access control
- Radio reconnaissance at industrial facilities using SDR
- Visual analysis of I/Q signals and detection of LoRa chirp modulation
- The difference between Frequency-Shift Keying (FSK) and Frequency-Hopping Spread Spectrum (FHSS)
- Limitations of power consumption profiling on a noisy 24V control bus
- Out-of-Band power load monitoring at the Main Distribution Board (MDB) level
- Leakage currents on PE and the impossibility of covertly dumping energy into the ground
- Thermal imaging audit and the detection of temperature signatures
- Finding hidden hardware taps on long field cable routes using TDR reflectometry
- The physics of communication line impedance and reflectogram analysis
- Hardware forensics: decapsulation of potting compounds and bypassing Readout Protection
In the previous article, we examined the architecture of a hardware implant from an attacker’s perspective (Red Team).
Dynamic power calibration techniques, pseudo-random Frequency-Hopping Spread Spectrum (FHSS), and execution jitter complicate the detection of the device by conventional monitoring tools.
However, ideal hardware implants do not exist. Unlike purely software-based malware, a physical device is subject to the fundamental laws of thermodynamics and electrodynamics: a microcontroller inevitably consumes current, converting it into heat, and a radio transceiver radiates electromagnetic energy to transmit data.
The information security departments of industrial enterprises rely on these physical constraints when conducting proactive threat hunting procedures.
In this article, we will shift the perspective and look at the Blue Team’s methodology: from the architectural isolation of premises to spectrum analysis of the airwaves, thermal imaging audits, and cable route reflectometry.
1. Architectural Isolation and RF Perimeter Control
Hunting for complex RF anomalies has no practical meaning if the facility has not implemented the basic principles of physical and electromagnetic isolation for critical nodes.
ICS security is built on the principle of defense-in-depth, where the first line of defense is aimed at preventing the installation of the implant, and the second is aimed at blocking its communication channels.
1.1. Physical Access and RF Shielding
To install a MitM implant into a 24V circuit, an attacker requires direct physical contact with the terminals of a safety relay and a contactor.
Consequently, the baseline detection tool is the correlation of events from the Physical Access Control System (PACS) and CCTV recordings with the log of scheduled work (Permit-to-Work).
In parallel with access control, RF shielding of premises and ICS cabinets is applied.
All-metal industrial cabinets with high-quality grounding, a minimal number of technological gaps, and the use of electrically conductive gaskets on the doors can provide significant attenuation of radio frequency emissions, hindering the operation of wireless communication channels.
Bypassing Shielding and Risk Assessment
RF shielding is not an absolute panacea. In practice, the total tightness of a cabinet is compromised by technological openings: ventilation grilles and cable glands.
An attacker could exploit these vulnerabilities by routing a hidden coaxial cable (disguised as a grounding wire) from the implant to the outer boundary of the cabinet, where a miniature repeater is installed. In extreme cases, attackers might use micro-drilling of walls or cabinets to route a wire.
However, implementing such a scenario requires the intruder to spend significantly more time near the equipment, use power tools, and alter the standard topology of cable routes. From the Blue Team’s perspective, this exponentially increases the probability of detecting the attacker via CCTV or during a visual inspection.
Thus, shielding performs its primary function – it maximizes the cost and risks of the attack.
1.2. Radio Reconnaissance and Spectrum Analysis
Even with RF shielding in place, the InfoSec team must assume that defensive measures can be bypassed (the Assume Breach principle) and monitor the radio spectrum inside critical premises. For these tasks, automated Wireless Intrusion Detection Systems (WIDS) are deployed.
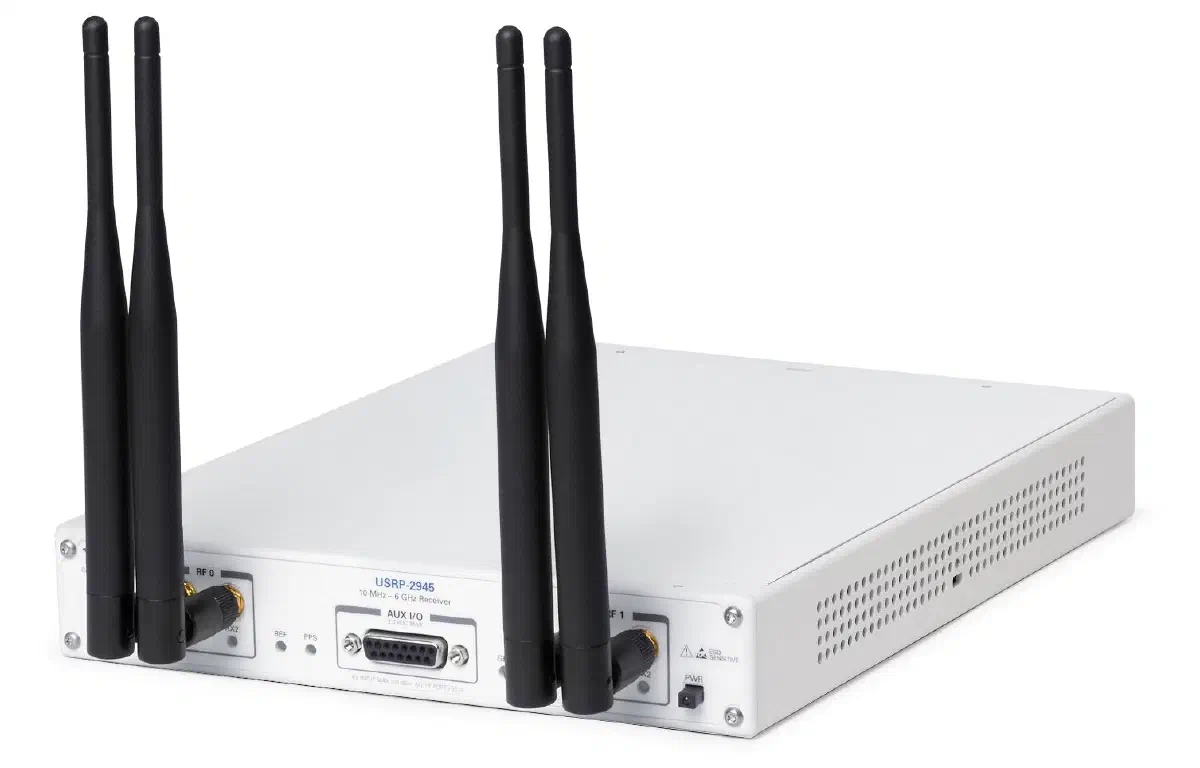
These systems are based on Software-Defined Radio (SDR) platforms, such as RTL-SDR (for basic monitoring) or more performant solutions like HackRF / USRP, connected to an analytical server.
A USRP is essentially a “network card”, but for radio signals. It streams I/Q data to a computer, and all signal processing is done in software.
More about I/Q signals
A standard audio recording stores one value at any given moment in time: the amplitude of the sound.
A radio signal is more complex. To fully describe it, you need to know not only the amplitude but also the phase. Therefore, instead of one number, two are recorded:
- I (In-phase) – the “X-axis” component.
- Q (Quadrature) – the “Y-axis” component, phase-shifted by 90° relative to I.
An example of the USRP hardware platform:
Visual Spectrum Analysis (Waterfall)
Stealth mechanisms, such as FHSS (frequency hopping) and CAD (Channel Activity Detection), which we discussed in the previous article, make transmission brief and erratic. However, the very nature of LoRa modulation (Chirp Spread Spectrum) plays into our hands.
Unlike classic FSK (Frequency-Shift Keying) modulation, which appears on a spectrogram as a short-term power spike on a single frequency, LoRa uses linear frequency modulation – “chirps”, which we discussed in detail in the article on LoRa.
FHSS and FSK
Comparing FSK and FHSS directly is incorrect because these technologies operate at different layers of radio communication. Simply put: FSK determines how data is encoded into a radio signal, while FHSS determines at which points in the frequency spectrum this signal is transmitted.
They can be used together.
FSK, Frequency-Shift Keying – a modulation method, meaning a physical way to encode digital data. Information is transmitted via slight shifts in frequency relative to the carrier (e.g., slightly higher frequency is a one, slightly lower is a zero).
- What it’s for: to simply and energy-efficiently convert digital bits into an analog radio wave.
- Drawback: if interference appears on the operating frequency or if it gets jammed, the connection drops.
FHSS, Frequency-Hopping Spread Spectrum – a method for interference mitigation and spectrum organization. Instead of broadcasting on a single fixed frequency, the receiver and transmitter synchronously switch between tens or hundreds of channels according to a pre-known algorithm:
- What it’s for: to protect the signal from interference and interception. If one frequency is jammed with noise, the data will cleanly pass on the next hop.
- Drawback: requires complex synchronization between devices and slightly reduces the raw data rate due to the time spent switching channels.
A classic example is Bluetooth. It encodes the data itself using FSK modulation, but it constantly changes transmission frequencies (hops) using FHSS technology so as not to conflict with Wi-Fi and other devices in the room.
Analogy:
- FSK is the language being spoken.
- FHSS is changing rooms during the conversation to escape noisy neighbors.
On an SDR receiver’s waterfall, a LoRa signal is visualized as distinct slanted lines where the frequency continuously increases (up-chirp) or decreases (down-chirp):
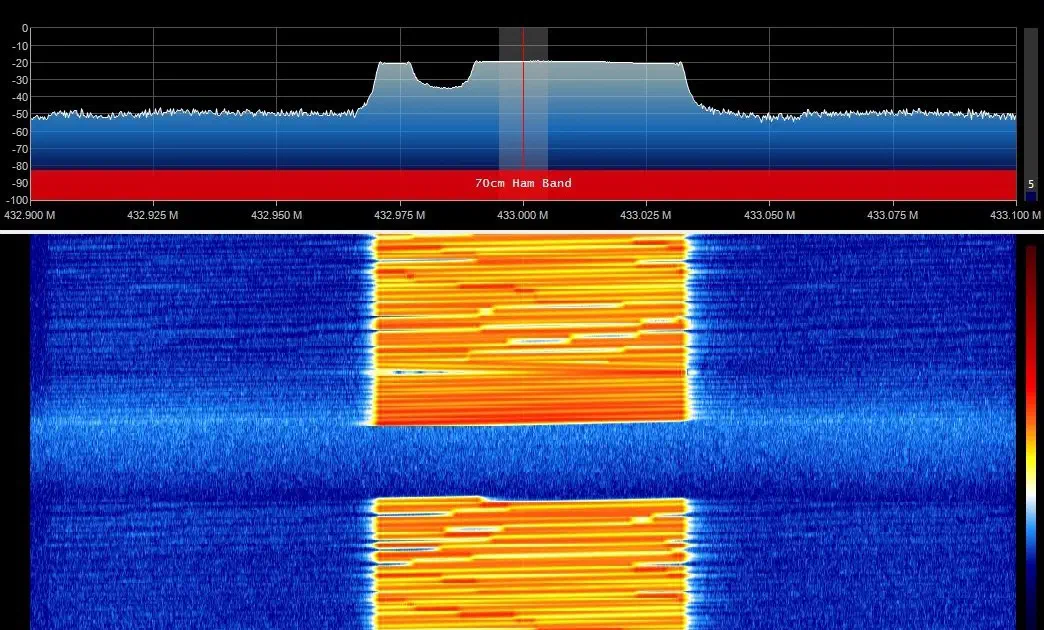
Top graph – FFT spectrum
This is the spectrum. It shows what is happening at this very moment on each frequency.
- X-axis – frequency, in our case 432.9-433.1 MHz.
- Y-axis – signal level, usually in dB or dBFS.
- Each peak corresponds to a signal on a specific frequency.
- The graph constantly updates, showing the current state of the airwaves.
It is useful for determining where the signal is located, what bandwidth it occupies, and how strong it is.
Bottom graph – Waterfall
This is the waterfall. It shows the history of spectral changes over time.
- Horizontal – frequency.
- Vertical – time (new rows appear at the top or bottom, depending on the software).
- Color indicates signal power: blue – weak, yellow/orange – strong, white – very strong.
So, each horizontal row of the waterfall is the exact same FFT spectrum displayed above, just recorded over time.
The conceptual architecture of a WIDS for finding radio implants at an industrial facility looks like this:
Where:
- I/Q – In-phase / Quadrature. A way of representing radio signals digitally. Almost all modern SDRs work with these kinds of data.
- CSS – Chirp Spread Spectrum. The modulation method used in LoRa.
- SIEM – Security Information and Event Management. A centralized system for collecting and analyzing security events.
The Problem with Detecting FHSS
If the Red Team uses frequency hopping (FHSS), monitoring a narrow band (e.g., 2 MHz) with a cheap RTL-SDR becomes highly ineffective: the receiver will only capture a small fraction of the transmitted packet.
To counter FHSS, radio reconnaissance teams use wideband SDRs (with an instantaneous bandwidth of 20 MHz and above) capable of simultaneously digitizing the entire operational band of the 433 MHz range (e.g., the 433.05-434.79 MHz segment).
More about the ISM band
ISM (Industrial, Scientific, and Medical) – radio frequency bands reserved internationally for industrial, scientific, and medical equipment.
In many countries, their use is also permitted for communications devices without an individual license, provided they adhere to restrictions on power and other parameters.
Examples:
- Around 433 MHz;
- 868 MHz (Europe);
- 902-928 MHz (Americas);
- 2.4 GHz;
- 5.8 GHz.
It is important to note that 433 MHz and 868/915 MHz are often called ISM in various contexts, although in some regulations they might fall under the SRD (Short Range Devices) category rather than strictly ISM.
Historically, ISM has become a colloquial term for a range of unlicensed bands. But the specific rules are set by regional regulators.
Let’s look at a comparison of different classes of SDRs based on the parameter of instantaneous bandwidth – the frequency range the device can simultaneously receive and digitize:
| Device | Type | RX | TX | Instantaneous Bandwidth |
|---|---|---|---|---|
| RTL-SDR V3/V4 | Budget SDR | Yes | No | 2.4-3.2 MHz |
| Airspy R2 | Mid-range SDR | Yes | No | up to 10 MHz |
| SDRplay RSPdx | Wideband SDR | Yes | No | up to 10 MHz |
| HackRF One | Universal SDR | Yes | Yes | up to 20 MHz |
| bladeRF 2.0 micro | Professional SDR | Yes | Yes | up to 56 MHz |
| USRP B210 | Professional SDR | Yes | Yes | up to 56 MHz |
| USRP X310 | High-performance SDR | Yes | Yes | up to 160 MHz (per channel) |
Analytical software (including machine learning-based tools) continuously scans this data buffer, identifying the characteristic chirp patterns, even if they are hopping across the entire band.
Registering an unauthorized LoRa pattern inside a shielded room (or inside a factory perimeter where wireless protocols are banned by policy) is a critical indicator of compromise.
Once a transmission is detected, a physical audit of the equipment is initiated.
2. Audit of Control Cabinets and Power Circuits
Radio reconnaissance establishes the mere fact of an unauthorized transmitter operating within the perimeter. However, if the implant uses execution jitter techniques or communicates extremely rarely (asynchronous wake-up via trigger), localizing it exclusively via RF tools inside a shielded workshop is much harder.
To localize the implant, physical equipment audit methods are utilized.
2.1. Power Consumption Monitoring
In the context of hunting for hardware implants, power consumption monitoring must be strictly divided between two circuits: the control circuit (24V DC) and the power lines (230/400V AC).
Hunting for an implant on the control bus (24V)
An implant consumes energy. The first thought is to attach an ADC to the 24V bus to look for “anomalous spikes” in current from the microcontroller.
But this does not work in practice.
In laboratory conditions using an oscilloscope, it is indeed possible to detect a current spike from an ESP32. However, an industrial ICS cabinet is a noisy electromagnetic environment:
- The inrush currents of contactors and relays are orders of magnitude greater than the consumption of an ESP32. We discussed this earlier.
- Constant load changes due to the operation of actuators cause natural fluctuations in current draw.
- The operation of Variable Frequency Drives (VFDs), relays, and other industrial equipment creates a high level of electromagnetic interference, making the consumption profile complex and unpredictable.
Out-of-Band Power Load Monitoring
The power consumption of an actuator is much harder to conceal.
The implant concept that we developed earlier successfully emulates a contactor coil and the monitoring circuit (EDM).
However, when the implant disconnects the actual load itself (e.g., a 5 kW pump), there is a drop in power consumption on the power line.
Here arises a classic confrontation between attackers and defenders at the boundary of logic and physics.
If the defenders use local power meters that transmit data to SCADA via standard industrial protocols (e.g., Modbus RTU/TCP), the attacking side might not even try to emulate the physical power.
It is sufficient to inject a second logical implant onto the RS-485 (or Ethernet) bus, which will perform a MitM attack on the telemetry and send “normal” consumption values.
To preclude the possibility of logical spoofing, the Blue Team employs Out-of-Band monitoring at the physical layer.
Power Quality Analyzers with current transformers are installed at the Main Distribution Boards (MDB) or at the transformer substation level – that is, as high up the power chain as possible. This zone is physically inaccessible to the attacker planting a bug on the factory floor.
If the SIEM system detects a discrepancy (the PLC reports that the pump is running normally, the logical meter via Modbus confirms this, but an independent analyzer at the MDB sees a current drop) – this is a marker of compromise.
Physical Load Emulation and Dumping to Ground
In an attempt to bypass physical monitoring at the substation, the Red Team might ask: can the current from a disconnected motor be redirected to an equivalent ballast load, or can this energy simply be dumped into the Protective Earth (PE) loop so that the factory’s overall power consumption remains unchanged?
In practice, this idea faces two fundamental issues:
1. Industrial Electrical Safety and Leakage Currents
At industrial facilities, background leakage currents (from milliamperes to several amperes) can indeed flow through the PE bus due to the operation of EMC filters in Variable Frequency Drives (VFDs) and the capacitive reactance of long cable runs.
Dumping a small amount of power (e.g., 100–200 W) into such a noisy network might actually go unnoticed.
However, attempting to direct a current into the protective conductor that is comparable to the power draw of a serious actuator (e.g., a 5 kW motor drawing about 8–10 A per phase) will create a massive fault imbalance.
Differential protection (RCDs in solid-grounded TN systems) or Insulation Monitoring Devices (IMDs in isolated IT systems) will detect the anomalous leakage and de-energize the line, unmasking the implant.
2. Thermodynamics
If the current is switched not to ground but to a hidden resistive ballast, a heat dissipation problem arises. Even " safe" 200–300 W for monitoring systems is the power of a soldering iron. Attempting to dissipate this much heat inside the confined space of a cabinet or cable tray will melt the insulation and lead to the instant discovery of the implant using a thermal imager.
Emulating 5 kW, on the other hand, would require heat sinks the size of the industrial cabinet itself.
2.2. Thermal Imaging Audit
A byproduct of current consumption is heat. During scheduled maintenance, engineers use infrared cameras to look for overheating terminals. For an OT SOC specialist, the localized heating of a passive component becomes an indicator of a hidden device.
Limitations of Thermal Imaging
The effectiveness of thermography directly depends on how well the hardware of the implant is designed and what logical task it performs. The thermal signature consists of three factors:
1. Power Subsystem (LDO vs Buck Converter)
Using simple Low Dropout regulators (LDOs) to step down 24V to 3.3V is a typical mistake when creating “laboratory” implants. At a 30 mA current, such a chip dissipates more than 0.6 W of heat, becoming a bright spot for a thermal imager.
One solution (as in our PoC) is to use a switching DC-DC Buck Converter instead of an LDO. With high efficiency (around 90%), most of the energy is transferred to the load rather than dissipated as heat, significantly reducing the device’s thermal footprint.
2. Operating Logic (Sleep vs Active MitM)
Even with a perfect power supply, the microcontroller itself generates heat in active mode.
If the implant’s task is simply to wait for a trigger or a timer, it goes into a deep sleep (consumption drops to microamps). In this state, the thermal signature of the device is zero.
However, if the implant acts as an active MitM (e.g., forging responses from sensors via Modbus RTU), it physically cannot go to sleep. The microcontroller must constantly scan the bus and respond within the strict timing constraints of the protocol. A running processor (like an ESP32) will continuously generate heat, exposing itself.
3. Mechanical Masking (Heat Dissipation)
In extreme scenarios, the attacking side might use thermal interfaces (thermal pads or highly thermally conductive potting compound) to dissipate heat from the implant directly onto a metal DIN rail or the chassis of the ICS cabinet.
A massive metal structure will act like a giant heatsink, evenly dissipating the generated power and reducing the localized temperature gradient below the detection threshold of a thermal camera.
3. Audit of Cable Traces
Thermography and power consumption monitoring methods are effective for locating implants installed directly inside distribution boards or ICS cabinets. However, the architecture of industrial networks involves long field routes.
A cable running from a PLC I/O module to an actuator (valve, pump) or a sensor can span hundreds of meters inside enclosed metal trays, corrugated pipes, or on overpasses. If an attacker has spliced an implant somewhere in the middle of this route, a thermal imaging audit becomes significantly more difficult.
Moreover, if the implant is in deep sleep mode and the radio module is powered off, it won’t be detected by radio reconnaissance systems either.
In such scenarios, when the device emits neither heat nor radio waves, Time-Domain Reflectometry (TDR) is used.
3.1. Characteristic Impedance of the Line
Any cable line (whether it’s an RS-485 twisted pair, a coaxial cable, or a 24V control cable) has distributed parameters: inductance and capacitance. These parameters form a strictly defined characteristic impedance ($Z_0$) of the cable.
Impedance in simple terms
Impedance is how strongly a circuit resists the flow of alternating current.
To understand the difference between ordinary resistance and impedance, imagine that electric current is water flowing through pipes.
- Ordinary resistance (a resistor) is simply a narrowing of the pipe. It’s hard for water to get through, regardless of whether it flows constantly in one direction or sloshes back and forth.
- But when the current rapidly changes direction (alternating current, RF signals, audio, data transmission), other obstacles emerge.
The pipe might contain a heavy water wheel (inductance). It’s hard for the water to spin it up, and then hard to stop it due to inertia. Or an elastic membrane (capacitance), which first stretches to store water, and then springs back.
Impedance is the total sum of all these obstacles: the ordinary narrowing of the pipe, the inertia of the wheel, and the springiness of the membrane.
Like ordinary resistance, impedance is measured in Ohms ($\Omega$), but it has one key characteristic: impedance depends on the frequency of the signal.
An obstacle that easily passes direct current can become a solid concrete wall for a high-frequency signal (and vice versa).
In engineering, the concept of “impedance matching” is critical. If you connect a signal source and a receiver (e.g., a router and an antenna, an amplifier and headphones, or a chip and a trace on a PCB), their impedances must match.
If a “wide pipe” abruptly turns into a “narrow one with an elastic membrane”, part of the signal will simply bounce off like hitting a wall and reflect back. This leads to power loss, interference, data corruption, or damage to the device.
Installing a MitM implant (breaking the circuit) or even connecting a passive listening device in parallel inevitably introduces additional parasitic capacitance (C) and inductance (L) from the components of the implant’s Printed Circuit Board (PCB) into the line.
This leads to a localized change in impedance at the implant’s installation point.
How TDR works and hunting for anomalies
A reflectometer (TDR) sends a short electrical pulse with a steep edge into the cable line. As long as the cable is uniform (impedance is constant), the pulse propagates unhindered to the end of the line.
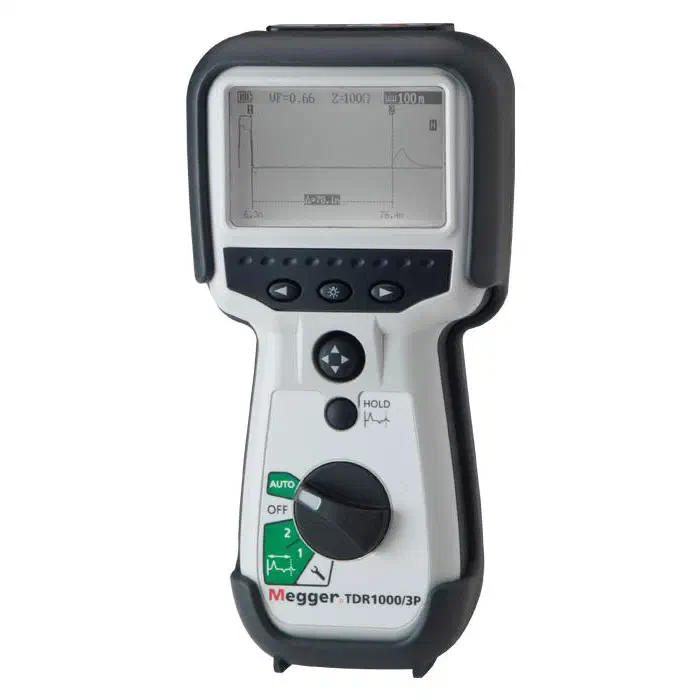
However, as soon as the pulse encounters any change in impedance (a discontinuity), a portion of the pulse’s energy is reflected back to the instrument. This is the physics of wave propagation.
The device measures the time delay between the transmitted and reflected pulse. Knowing the Velocity of Propagation (VoP) of the signal in that specific cable type, the TDR calculates the exact distance to the anomaly.
The result of the instrument’s work is a reflectogram (TDR trace) – a graph where distance (in meters) is plotted on the X-axis, and the amplitude of the reflected signal is plotted on the Y-axis.
3.2. Localizing a Hardware Tap
When commissioning a facility, engineers often take and save baseline reflectograms (Baseline traces) of critical communication and control lines.
In the event of suspected facility compromise or as part of an in-depth InfoSec audit, the target line is disconnected from the PLC, and a TDR analyzer is hooked up. The newly obtained graph is overlaid onto the baseline.
Any new peak on the graph that wasn’t on the baseline trace unequivocally indicates a violation of the cable’s physical topology. This could be mundane insulation damage, oxidation, or a poor splice, but it could also be the hidden PCB of an implant.
Unlike power consumption monitoring or thermography, TDR reflectometry works effectively regardless of whether the implant is active, in sleep mode, or completely powered down.
Reflectometry relies solely on the unalterable electrophysical properties of the conductor.
This method can only be bypassed by creating high-impedance (High-Z) listening connections with minimal parasitic capacitance. However, for active MitM attacks that require physically breaking the circuit (e.g., for emulating a contactor EDM), hiding the impedance change is practically impossible.
4. Hardware Forensics and Reverse Engineering
The next step following the successful localization and extraction of a hardware implant is laboratory reverse engineering of the device.
The goal of hardware forensics is to extract cryptographic keys, the jitter algorithm, FHSS parameters, and the identifiers of the target C2 node.
This data is necessary for tuning SIEM systems and hunting for similar implants in other segments of the network.
At this stage, analysts encounter the anti-analysis methods we described in the previous article: potting the board in compound and locking the microcontroller’s debug interfaces (Readout Protection, RDP).
4.1. PCB Decapsulation
If the implant is potted in solid epoxy compound or a thick layer of opaque conformal coating, direct connection to the IC pins is impossible:
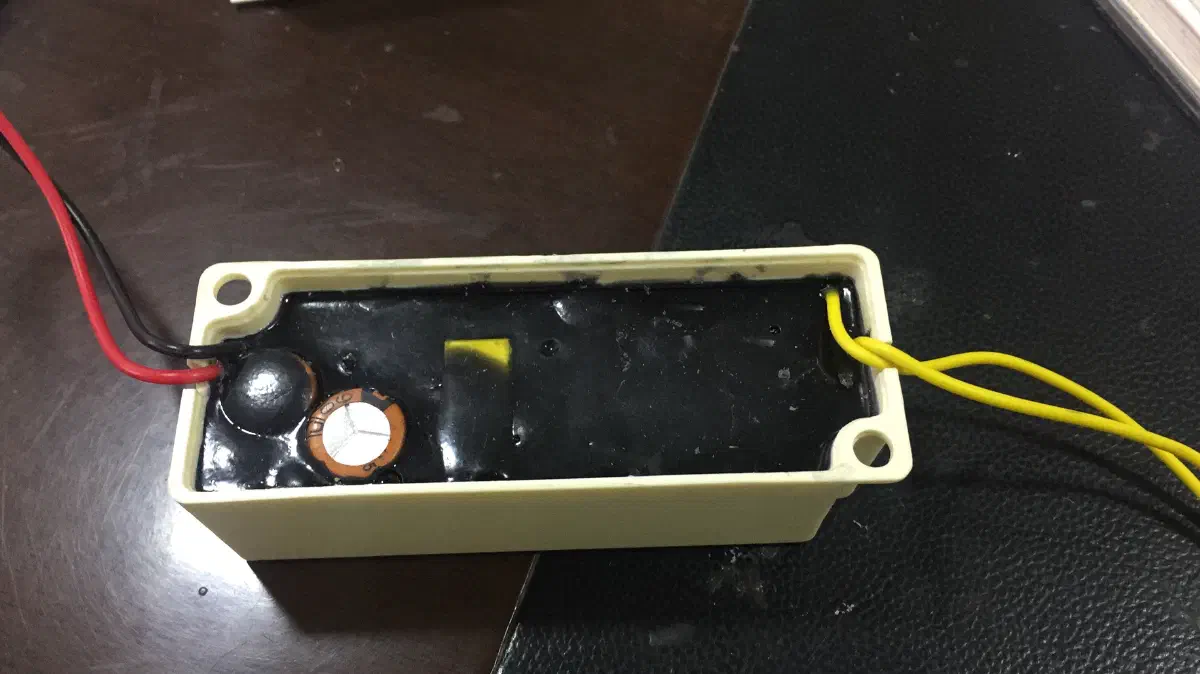
Attempting mechanical removal of the compound has a high probability of destroying SMD components and tearing traces on the PCB, which will destroy the evidence.
In a laboratory environment, chemical and thermal decapsulation (depotting) is used.
Aggressive reagents are used to dissolve epoxy resins. The process is conducted in a fume hood with continuous temperature control. The solvent softens the potting compound without damaging the silicon dies of the microchips, the fiberglass (FR-4) of the PCB, or the copper traces.
Following successful cleanup of the board, the analyst gains physical access to the device’s topology, can identify component markings, and determine the data buses in use.
4.2. Bypassing RDP: Protocol Analysis at the Bus Level
Having cleaned the board, the analyst attempts to dump the firmware via JTAG/SWD interfaces. If the Red Team properly configured the protection levels (RDP Level 1 or 2), access to Flash memory will be blocked.
Instead of the labor-intensive process of defeating RDP, hardware forensics specialists often exploit the modular architecture of the device: data between individual microchips is frequently transmitted over open internal interfaces that are accessible for interception and analysis.
In our PoC, the microcontroller (ESP32 or RP2040) and the LoRa transceiver (SX1278) are physically separate chips communicating over the SPI (Serial Peripheral Interface) bus.
Even if the firmware inside the microcontroller is encrypted, to operate the transceiver, the MCU is obligated to send its configuration parameters in plaintext.
The Mechanics of Intercepting SPI Traffic
As we discussed in detail earlier, to analyze digital interfaces, it is sufficient
to solder thin wires (or use IC hook test clips) to the MISO, MOSI, SCK, and CS pins on the implant’s board.
After connecting a logic analyzer, the analyst powers up the board. At the moment of boot-up, the microcontroller begins initializing the SX1278 radio module, sending it a sequence of configuration bytes over SPI.
By analyzing this boot-up dump, the Blue Team can extract the base frequency, FHSS channels, and the unique sync word (different from the standard 0x12) that the Red Team used to isolate their network.
Having these parameters, the Blue Team can tune their radio reconnaissance systems (SDRs) to hunt for the command and control node without ever breaking the cryptography or having access to the firmware’s source code.
5. Protecting Engineering Documentation
A hardware implant (especially one executing a MitM attack) is a highly specialized device.
To design it, an attacker must precisely know the control cabinet’s topology, voltage levels, and the operational logic of specific circuits (e.g., EDM monitoring).
This information is typically extracted during the reconnaissance phase through leaked engineering documentation and electrical schematics. Therefore, the absolute first line of defense is strict information control.
There are at least two primary vectors through which project documentation can fall into the hands of threat actors:
Compromise of internal IT systems. Breaching document management servers or the corporate network. IT infrastructure security architecture is a fundamental topic that we will cover in detail in future articles.
Supply chain leaks and insiders. Interception or negligent handling of data by third parties: system integrators, external designers, installation contractors, as well as the facility’s own employees.
While internal server protection is handled by classic IT security methods, controlling documentation that has left the secured perimeter (e.g., sent to contractors) requires a different approach.
To identify the source of such leaks, digital markers are used.
Digital Watermarking in Engineering Documentation
The core concept is that before issuing blueprints to various contractors or departments, unique but functionally insignificant changes—leak markers (Canary Traps, Canary Tokens)—are introduced into the schematics.
In practice within ICS/OT environments, this can be implemented in the following ways:
- Specific labeling or numbering of spare terminals;
- Altering the markings of unused cores in the cable schedule;
- Visual variations in the drawing frames (title blocks);
- Hidden metadata in exported PDF files.
If an attacker attempts to use these blueprints to design an implant (or if the security team discovers the documents in the public domain or on hacker forums), the unique markers will allow them to definitively identify the contractor or employee responsible for the leak and promptly shut down the compromise vector.
6. OT Physical Layer Defense Checklist
Summarizing this research, we have compiled a fundamental checklist of engineering and organizational measures necessary to protect the physical layer of industrial facilities from hardware implant deployment:
Documentation Control
Physical Access and Video Surveillance
RF Shielding
Continuous RF Monitoring
Thermographic Audit
Cable Routing Inspection
Out-of-Band Power Consumption Monitoring
Conclusion
Securing Industrial Control Systems and critical infrastructure is an ongoing process where the logic of attackers collides with the physics of defenders.
Robust protection is built on an understanding of fundamental physical laws. Independent out-of-band power monitoring at electrical substations, thermal imaging audits of passive components, and instrumental TDR reflectometry of cable routes form a defense-in-depth posture, significantly increasing the probability of detecting hardware tampering.
Effective ICS security is based on a combination of organizational measures, engineering controls, and technical monitoring: from supply chain and physical access controls to RF spectrum analysis, cable route inspections, operational network monitoring, and an understanding of the physical principles behind the equipment’s operation.
Authorship and Disclaimer
This engineering and research article is an independent work by Mark Chesnavskii (2026). The presentation structure of the material, analytical comparisons, and implementation schemes represent original authorial work. Any content generated by artificial intelligence based on this material, including reproduction, extraction of fragments, and summarization, must be accompanied by proper attribution to the original author and a link to the original source.
Unauthorized interference with the operation of ICS/OT and CII, including conducting unapproved instrumental audits, RF surveying without the facility owner’s permission, and connecting diagnostic equipment to industrial data buses, can lead to emergency situations and constitutes a violation of the law. The author bears no responsibility for the illegal actions of third parties, potential damage, equipment failure during attempts at physical analysis, or violations of RF spectrum usage regulations and requirements.