Datadog Spring Boot integration
- Datadog Spring Boot setup
- How to integrate Datadog Spring
- Spring Boot Datadog quickstart
- Configure Datadog Spring Boot
First things first, we can generate the starter project using https://start.spring.io/. Select these dependencies:
- Spring Boot Actuator
- Datadog
- Spring Web
Then, using documentation here, we should set API Key, Application Key and Datadog URI in application.properties file:
management.datadog.metrics.export.api-key=your-api-key
management.datadog.metrics.export.application-key=your-application-key
management.datadog.metrics.export.uri=https://us5.datadoghq.com
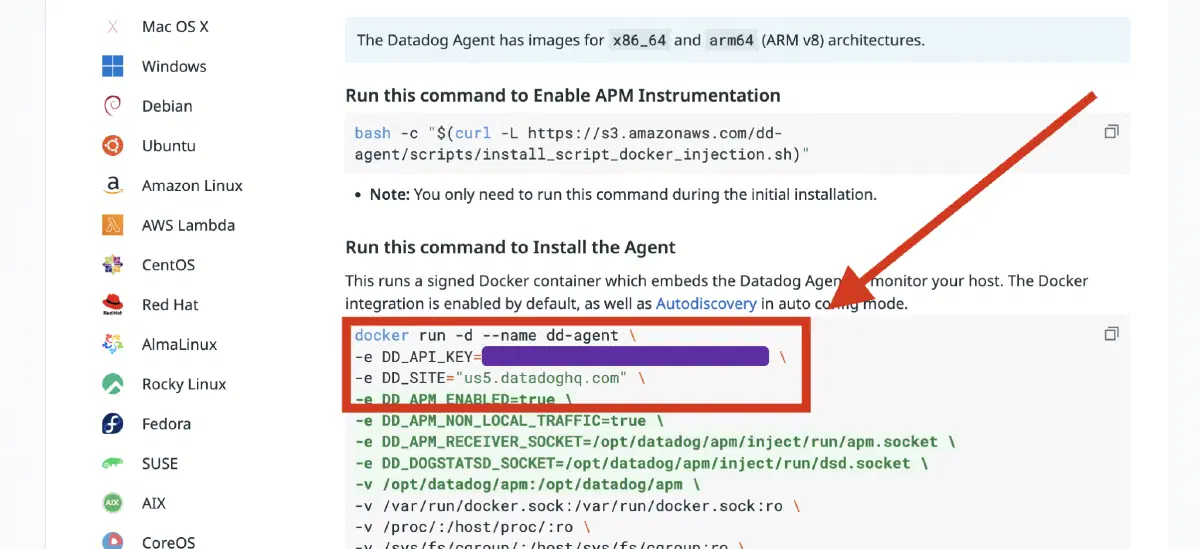
You can get your API Key and Datadog URI from startup Datadog screen:
By the way, Datadog has a trial period.
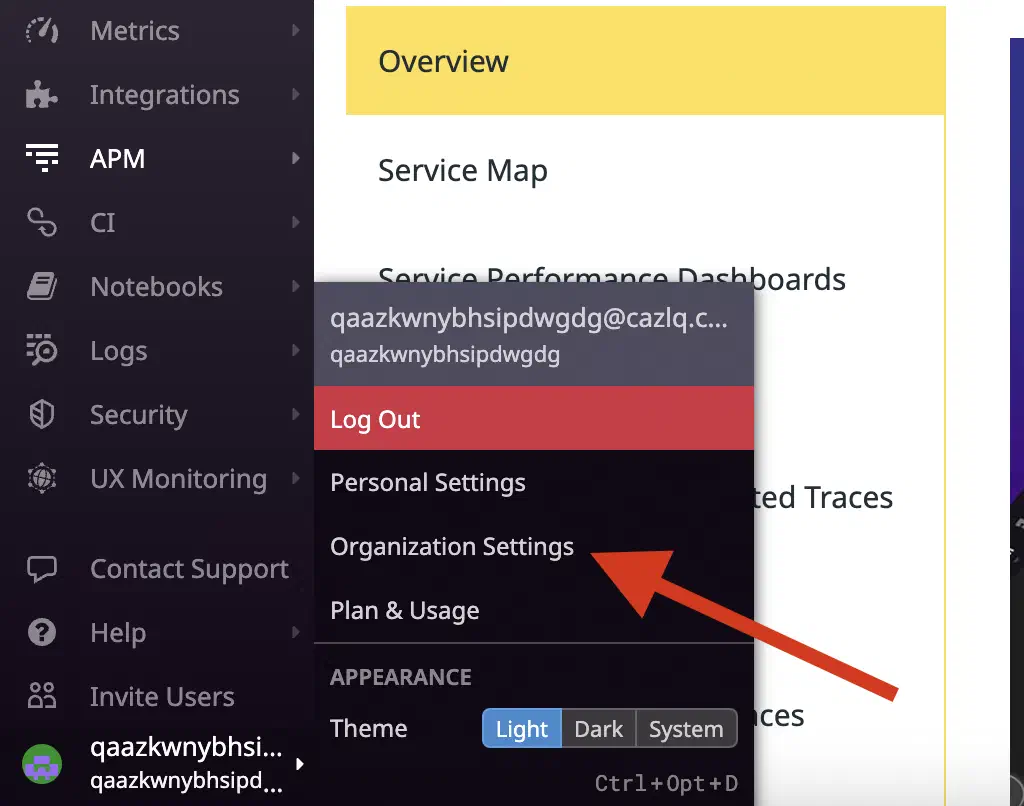
Application Key can be generated under Organization Settings -> Application Keys under your profile section:
Next, let’s create a controller TestController.java:
@RestController
public class TestController {
    @Timed("lightAPI")
    @GetMapping("/light")
    public ResponseEntity<Void> light() {
        return new ResponseEntity<>(HttpStatus.OK);
    }

    @Timed("heavyAPI")
    @GetMapping("/heavy")
    public ResponseEntity<Void> heavy() throws InterruptedException {
        Thread.sleep(924);
        return new ResponseEntity<>(HttpStatus.OK);
    }
}
Notice @Timed annotation. To make it work, we should add Spring Aspects dependency:
<dependency>
    <groupId>org.springframework</groupId>
    <artifactId>spring-aspects</artifactId>
</dependency>
And create a bean of type TimedAspect:
@Bean
TimedAspect timedAspect(MeterRegistry reg) {
    return new TimedAspect(reg);
}
Temporarily switch logging level to TRACE:
logging.level.root=TRACE
And find the following in Spring logs (number can vary):
successfully sent 84 metrics to datadog
If you interested what metrics actually being sent to Datadog, you can add a breakpoint to DatadogMeterRegistry class from micrometer-registry-datadog-<version>.jar to this line:
sending metrics batch to datadog:{}{}
It’s time to check metrics in Datadog UI. These are two handy pages:
- https://us5.datadoghq.com/metric/summary. Here you can find a list of metrics you have.
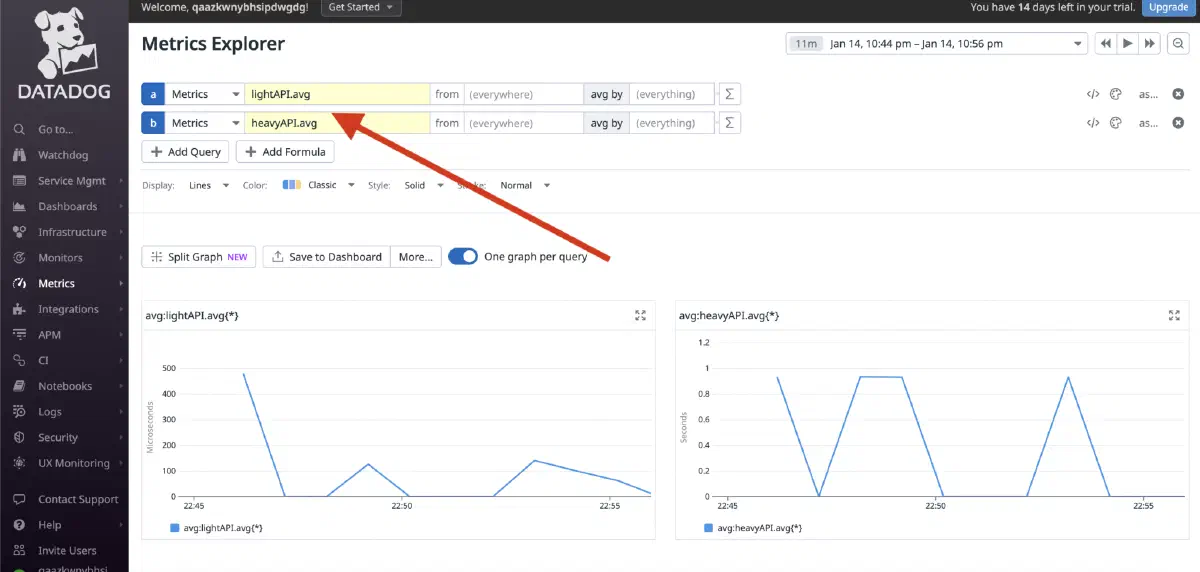
- https://us5.datadoghq.com/metric/explorer. Here you can build kind of a dashboard, and visualize your metrics using charts.
Give it a few minutes if you don’t see your metrics (keeping in mind that there are no errors in Spring app).
You see that in our case, lightAPI works really fast, but heavyAPI works slower (because of Thread.sleep()):
Alright, now let’s add a tracing collection. Download Datadog agent:
wget -O dd-java-agent.jar 'https://dtdg.co/latest-java-tracer'
Build fat jar from Spring application simply running clean + package Maven actions from IntelliJ IDEA.
Run Docker container with agent. Remember to add your API Key and Datadog URI (not Application Key!) as we did in application.properties:
docker run -d --cgroupns host --pid host --name dd-agent \
  -v /var/run/docker.sock:/var/run/docker.sock:ro \
  -v /proc/:/host/proc/:ro \
  -v /sys/fs/cgroup/:/host/sys/fs/cgroup:ro \
  -e DD_SITE=us5.datadoghq.com \
  -e DD_API_KEY=your-api-key \
  -p 8126:8126 \
  gcr.io/datadoghq/agent:7
Run Spring app using this command. You can choose your own service name and environment:
java -javaagent:/path/to/dd-java-agent.jar \
  -Ddd.logs.injection=true \
  -Ddd.service=spring-test \
  -Ddd.env=dev \
  -jar /path/to/fat/spring/app.jar
Double check that you have no logs in Spring app and Datadog Agent container either.
Give them few mins to be uploaded to the server, and go to APM -> Traces page:
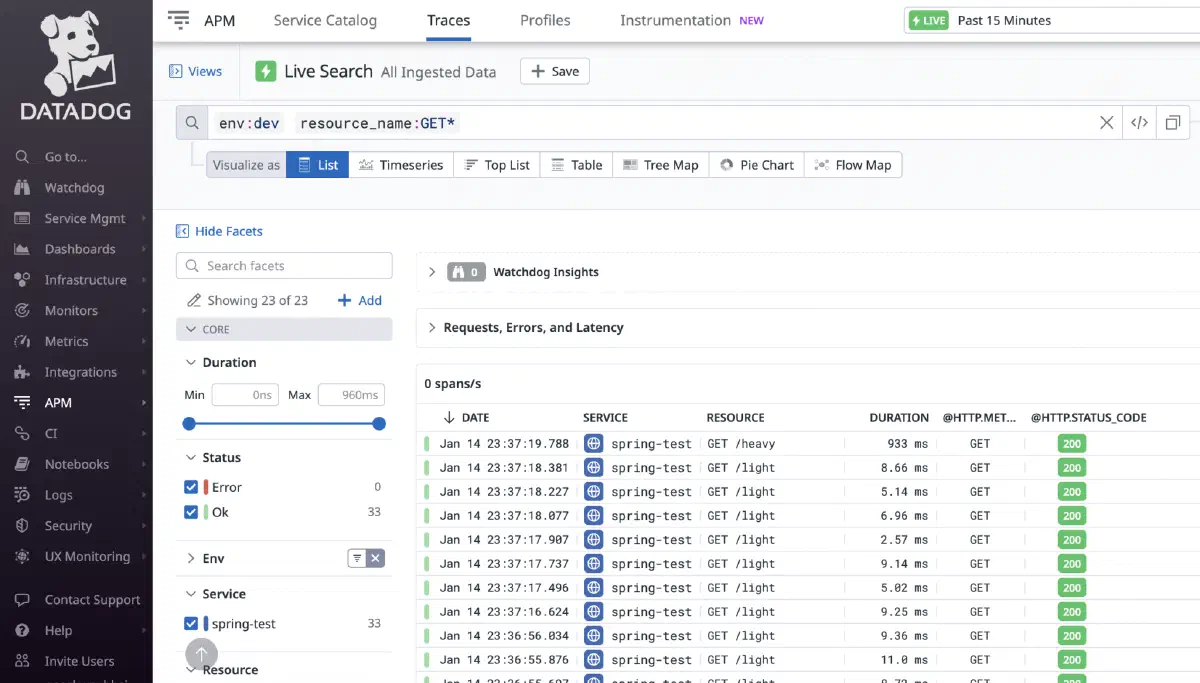
Eureka! It works!