Datadog trace count mismatch
- Datadog trace count discrepancy
- Datadog apm monitor mismatch
- Datadog trace count incorrect
- Fix Datadog apm counting
You may run into a case when your Datadog APM monitor, configured for trace counting, shows a weird, usually low number of traces, compared to a Trace Overview section. Look at this monitor:
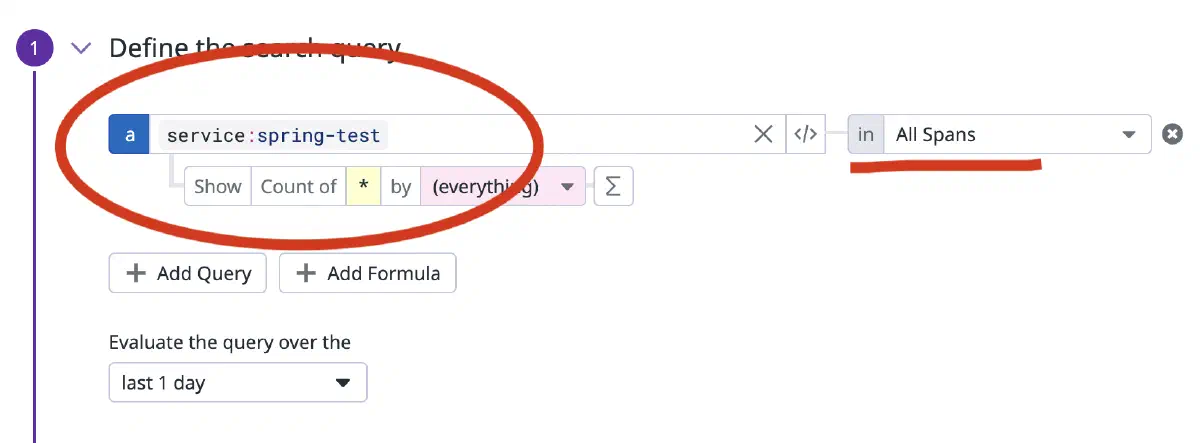
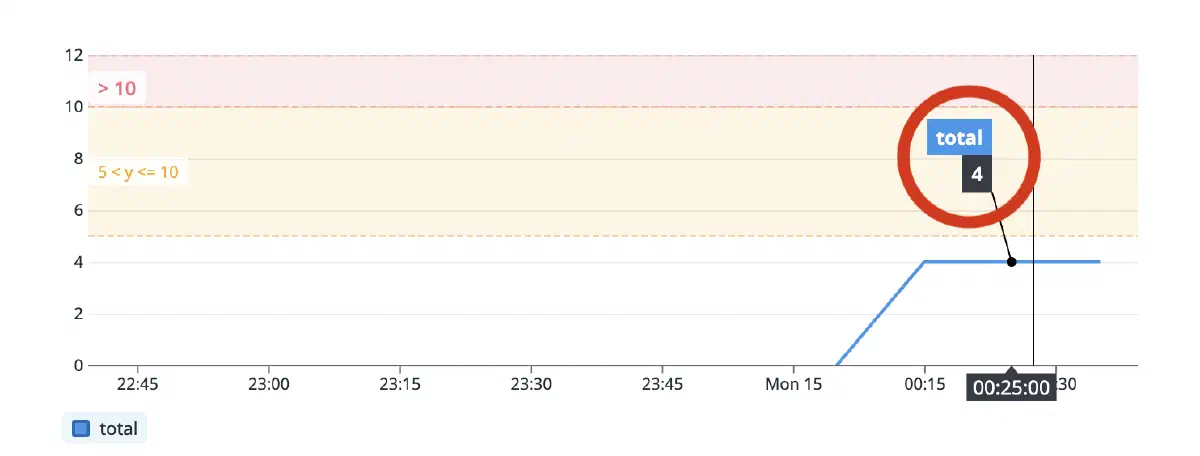
It shows four spans:
However, Trace Overview shows 28 spans/traces for the same time range:
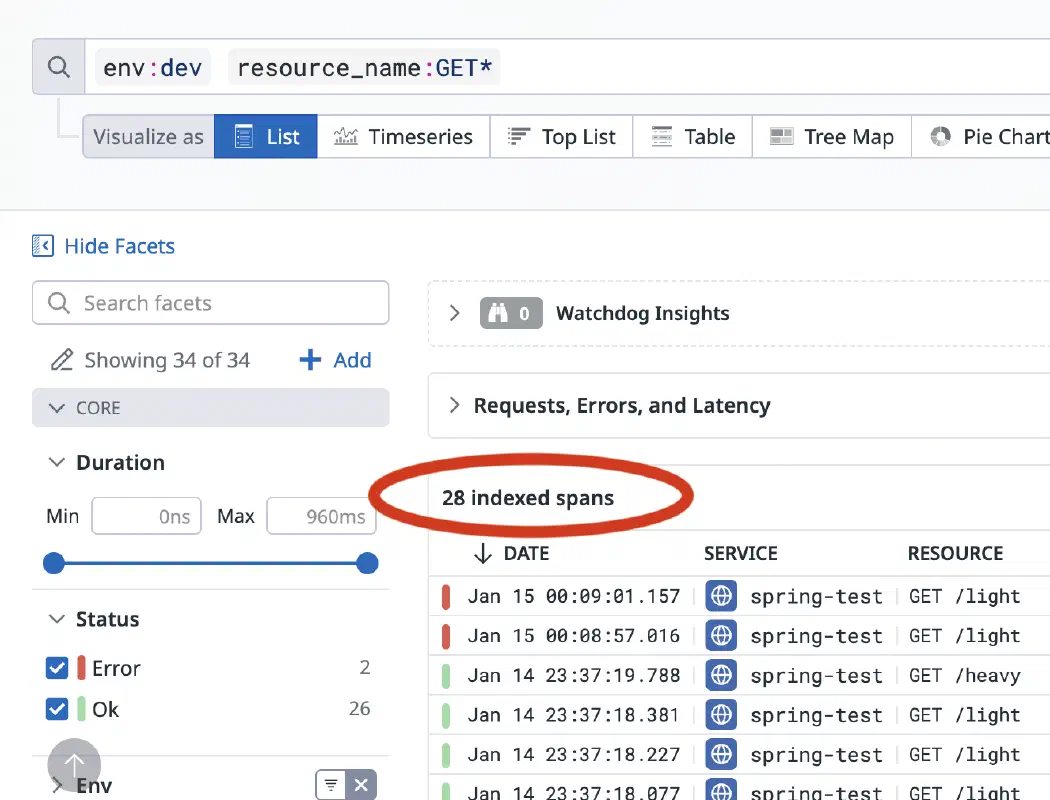
The main question here: why?
There is a tool named Datadog Notebooks. You can create a new one and construct your query:
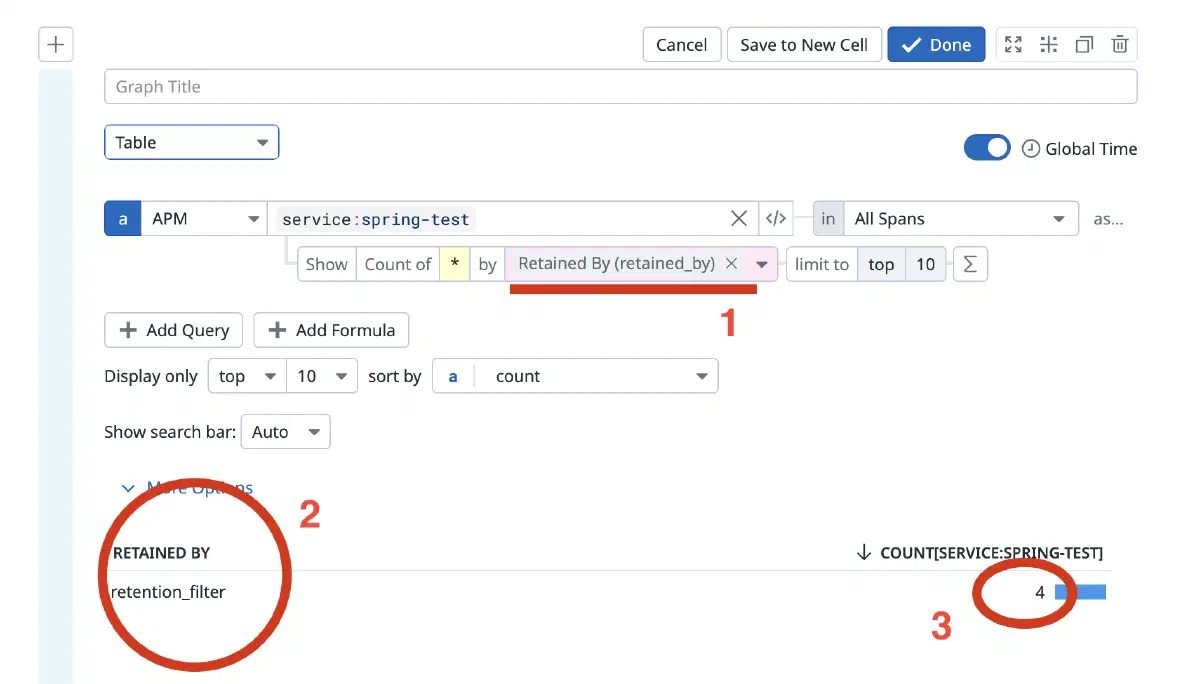
I encourage you to select Retained By option when grouping results (1). You see, that we have only one retention reason available: retention_filter (2). And our trace count is small (3).
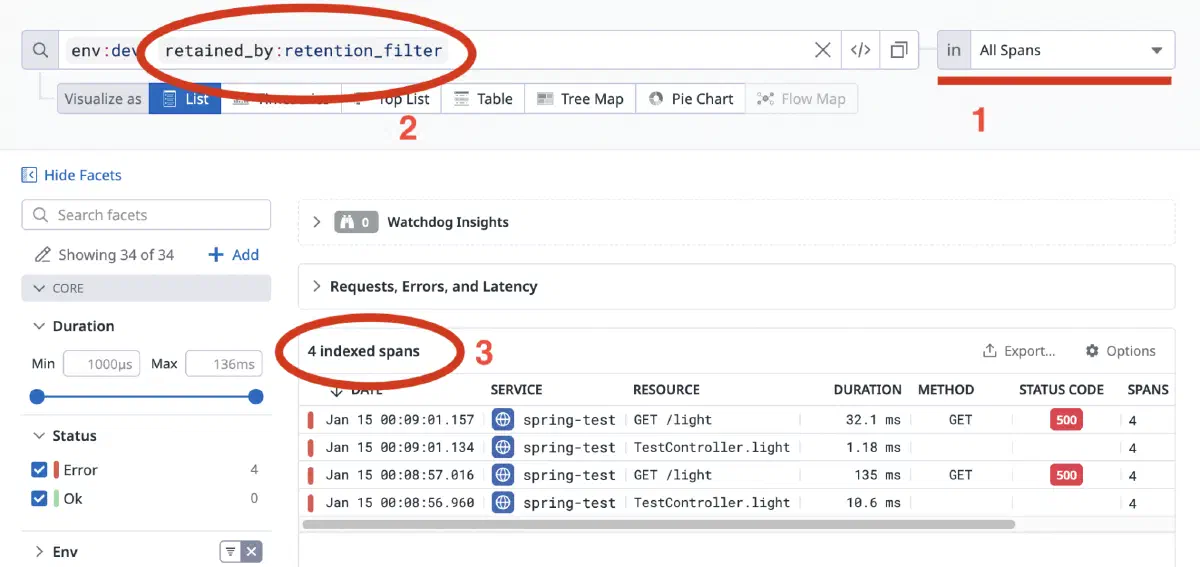
This is the answer! You can impersonate APM monitor logic by yourself in Trace Overview page by choosing “All Spans” scope (1), adding explicit retained_by:retention_filter to the search query (2) and boom – you see the same amount of traces/spans that APM monitor shows:
If you wonder where this thing is located in the Datadog docs, here you go.
Quote: “spans indexed by the intelligent retention filter are excluded from APM queries that appear in dashboards and notebooks and also excluded from trace analytics monitor evaluation”.